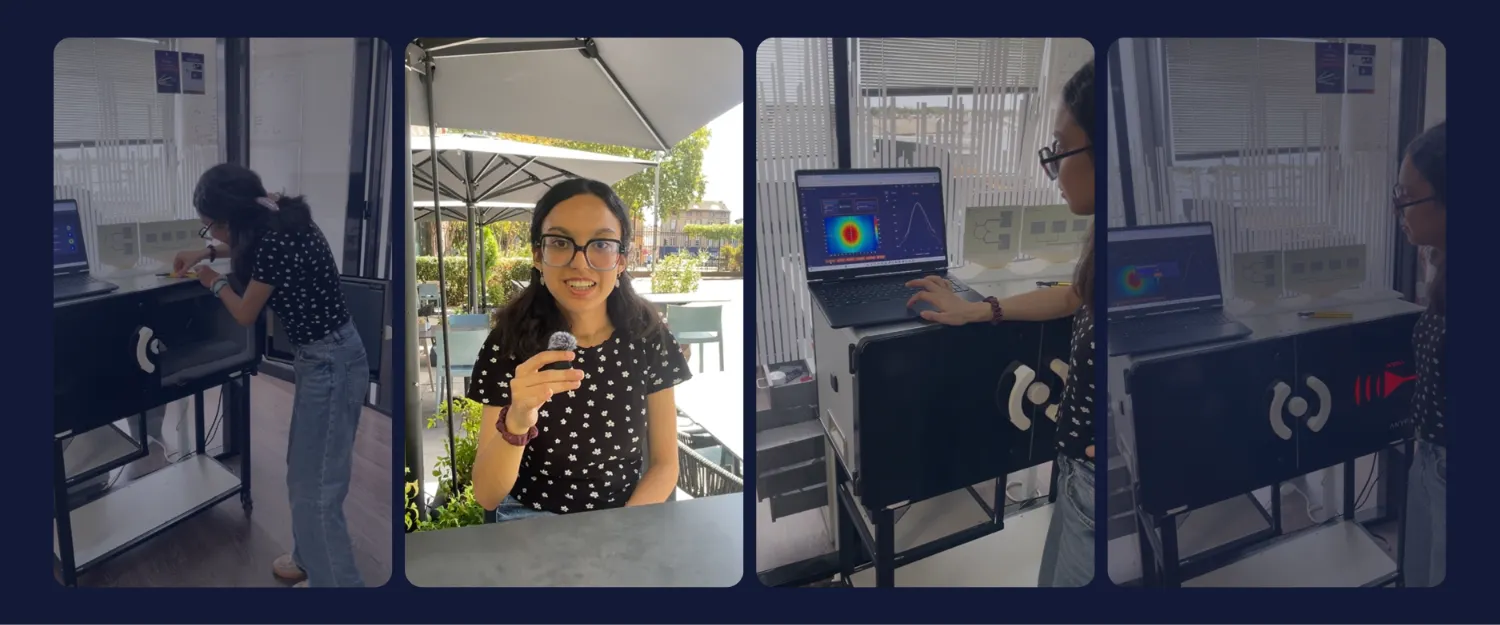
"I would sum up my experience as fascinating and deeply enriching for anyone who loves physics."
Imane Khalloufi, electronics engineering student, ENSEEIHT
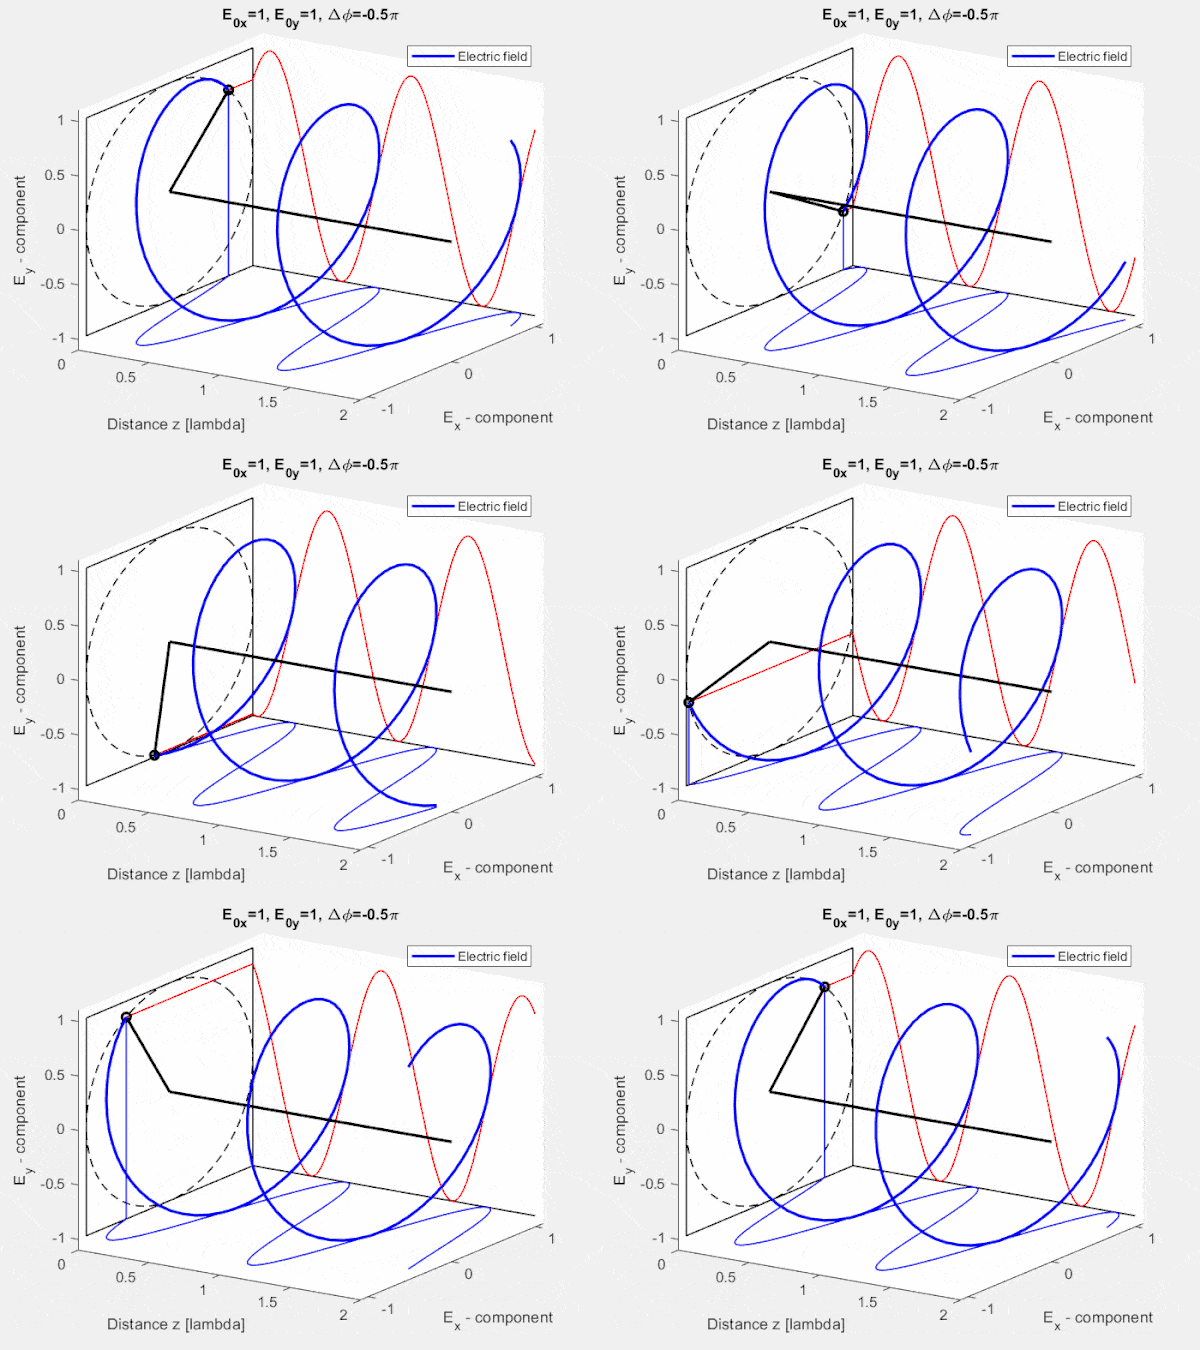
An electromagnetic wave is invisible. Its polarization, the orientation of its electric field, is even harder to grasp. A field map shows how strong the field is, but not which way it points.
During her internship at the LAPLACE laboratory in Toulouse, engineering student Imane Khalloufi set out to recover that missing information on a patch antenna. Her test bench was EMBox Lab. Here is her method, what she measured, and what she would improve.
In brief
- The goal: determine the linear polarization of a patch antenna from E-field maps, which show field amplitude but not its direction.
- The method: a reference map of the antenna alone, then a map with a polarizer, then a map with the polarizer rotated, to isolate each field component.
- The result: a validated method, an average cross-polarization to co-polarization ratio of -15 dB in the main lobe, and two new polarizers on PLA supports designed to limit edge effects.
- The most useful features: adjustable antenna distance and the direct overlay of two field maps on screen.
- The takeaway for professors: hands-on measurement turned abstract electromagnetic theory into physical intuition for an engineering student.
Who is Imane Khalloufi and what was her patch antenna project?
Imane Khalloufi is a 20-year-old engineering student specializing in electronics. She first spent two years in classes préparatoires, the intensive French preparatory program, in the mathematics and physics (MP) track. She then chose electronics, and plans to continue in radio frequency or integrated systems.
Her internship took place at the LAPLACE laboratory in Toulouse, of Toulouse INP and Toulouse III – Paul Sabatier University. She was supervised by Nathalie Raveu (ENSEEIHT). Her subject: the polarization of a patch antenna.
Nathalie Raveu also shares her view on hands-on RF teaching in our guide Teaching antennas and RF: 5 innovative methods to engage your students.
Why is polarization hard to read from a field map?
Polarization describes the orientation of the electric field radiated by an antenna, as defined in IEEE Std 145, the reference standard for antenna terminology. It can be linear, circular or elliptical. It matters because a receiving antenna only captures the field component aligned with its own polarization.
For a broader introduction to these fundamentals, read How antennas work: core concepts explained by an expert, with Adrien Laffont, PhD, Innovation Director at Anyfields.
EMBox Lab produces an E-field map: the amplitude of the total tangential electric field at the surface of its sensor. That map shows where the antenna radiates and how strongly. It does not directly show the direction of the field.
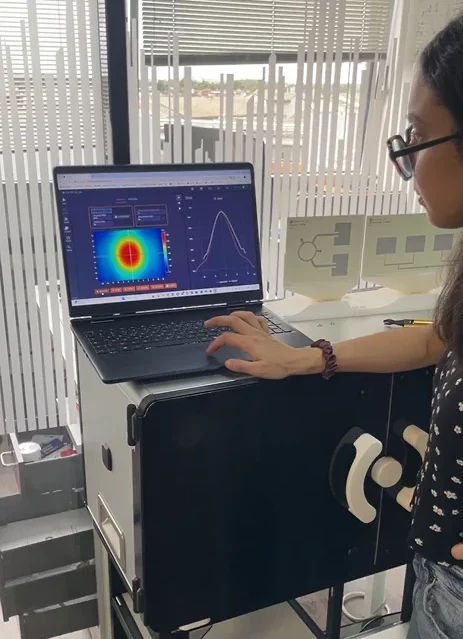
"Using EMBox Lab, I could access the map of the electromagnetic field, but not the polarization directly. My goal was therefore to obtain the polarization, in other words the direction of my electromagnetic wave."
Imane Khalloufi
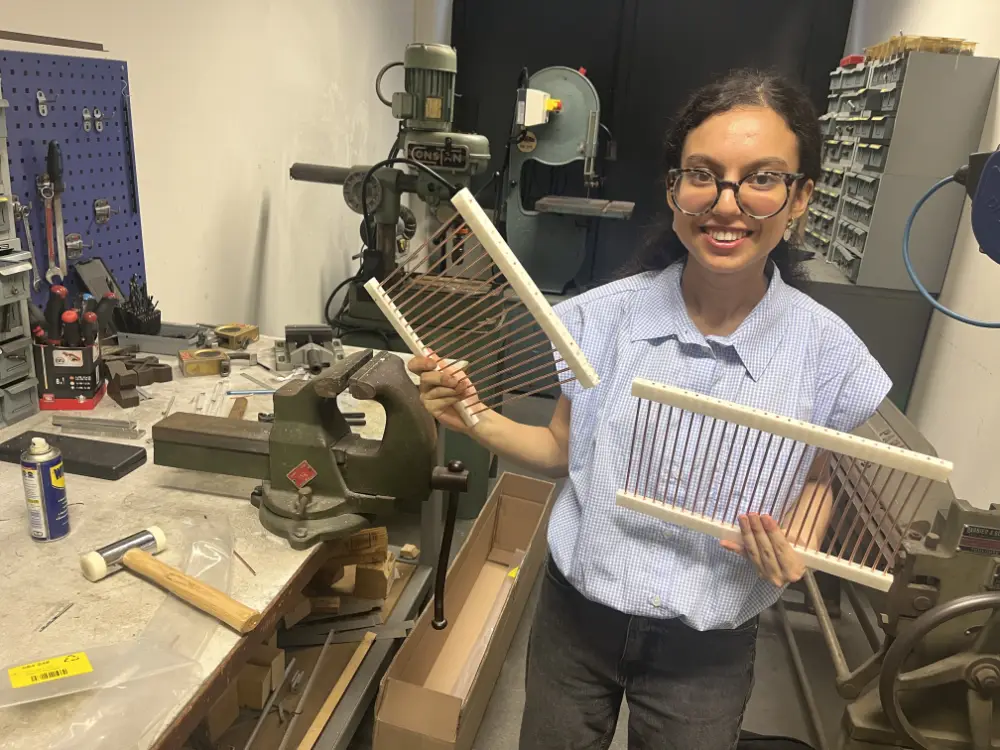
The project ran in two phases. First, she exploited the results obtained with an existing polarizer. Then, she had to either design a new method to determine the polarization or optimize that polarizer.
Video - Imane Khalloufi’s testimonial on EMBox Lab
In this video, Imane Khalloufi explains her internship subject, her measurement protocol on EMBox Lab and the results she obtained on the polarization of a patch antenna.
VNA, simulation, field mapping: which antenna measurement tools did Imane Khalloufi use?
Before EMBox Lab, Imane Khalloufi worked with two classic tools in her lab sessions on wave propagation: a vector network analyzer (VNA) and electromagnetic simulation with HFSS. The table below summarizes what each tool brings, alongside the field mapping she later used.
| Tool | What it measures or predicts | What it does not show on its own |
|---|---|---|
| Vector network analyzer (VNA) | S-parameters at the antenna port, such as reflection (S11) and impedance matching, at a given frequency | How the radiated field is distributed in space |
| EM simulation (HFSS) | Predicted antenna behavior, including the radiation pattern | Effects of the real prototype on the bench; in her experience, results were hard to relate to the physical antenna |
| Field mapping (EMBox Lab) | 2D map of the radiated E-field amplitude at the sensor surface | Field direction (polarization) and port parameters such as S11 |
Each tool answers a specific question, and both remain essential. What was missing in her case was a way to see, in the lab, how the radiated field is distributed in space.
What changes when you can see the field in two dimensions?
EMBox Lab maps the field across the X and Y axes of its sensor. One measurement gives an overall view of the radiated field rather than a value at a single point. According to the EMBox Lab technical documentation, a scan takes from 10 seconds.
"EMBox Lab provides a spatial field map across both the X and Y axes, which gives a global view of the field. On top of that, you can change the distance D at which you place the antenna, which is very interesting."
Imane Khalloufi
The adjustable distance let Imane Khalloufi work in the far-field region. She estimated the far-field boundary from the largest dimension of her patch antenna, about 42.5 mm. She then placed the antenna beyond that limit.
A common criterion for this boundary is the Fraunhofer distance, where D is the largest dimension of the antenna and λ the wavelength:
R_{ff} = \frac{2D^2}{\lambda}
For electrically small antennas, the distance should also be large compared with the wavelength. This is why the boundary depends on both the antenna size and the operating frequency.
How quickly can a student get started with EMBox Lab?
Imane Khalloufi was introduced to the software by one of her supervisors.
"It wasn't very complicated: you just had to provide some information, like the project name, the distance at which you place the antenna, and so on."
Imane Khalloufi
Imane Khalloufi shares one practical tip for new EMBox Lab users. Do not open EMBox Lab until the color of the antenna drawn on the outside of the box has changed. Early on, she opened the box by accident during a measurement, which slightly altered the results. It became a simple habit to adopt.
How to characterize a patch antenna with EMBox Lab: a 3-step protocol
Imane Khalloufi used EMBox Lab throughout the prototyping and characterization phase. Her protocol followed three steps:
- Reference measurement. Map the field of the patch antenna alone, without a polarizer.
- Measurement with the polarizer. Add the polarizer in front of the antenna and map the field again, to compare with the reference.
- Measurement with the polarizer rotated. Turn the polarizer to check whether the second field component passes or is blocked.
Comparing these maps reveals which component of the field the antenna actually radiates. This is how a measurement of field amplitude becomes a measurement of polarization.
Which EMBox Lab features help most on a student antenna project?
Two features stood out for Imane Khalloufi: the adjustable antenna distance and the overlay of two field maps.
Choosing the right antenna distance
EMBox Lab moves the antenna along a motorized rail, so the measurement distance can be set for each scan. For a polarization study, that distance is a trade-off.
- Too far: the polarizer could no longer be exploited correctly.
- Too close: the map did not capture all the characteristics of the antenna, such as the main lobe.
Finding the optimal distance was part of the method itself.
Overlaying two field maps
The second feature was the ability to overlay two maps directly on screen. In the EMSoft software, this is the Compare function, which also accepts imported simulation results from HFSS, FEKO or CST.
This is where Imane Khalloufi saved the most time. While building a new polarizer, the team compared materials, for example a version with and without Plexiglas. The question was whether Plexiglas distorted the electromagnetic field.
"Thanks to the overlay function, we were able to check the impact of the material instantly, directly on the screen, without having to export the data and do separate post-processing."
Imane Khalloufi
How to keep the same reference frame when measuring an antenna?
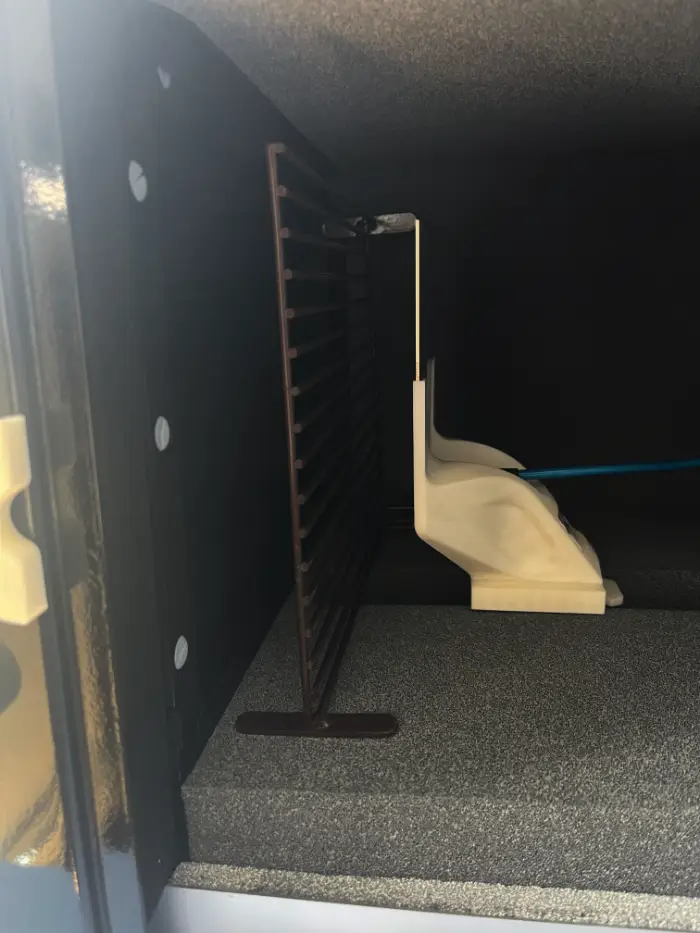
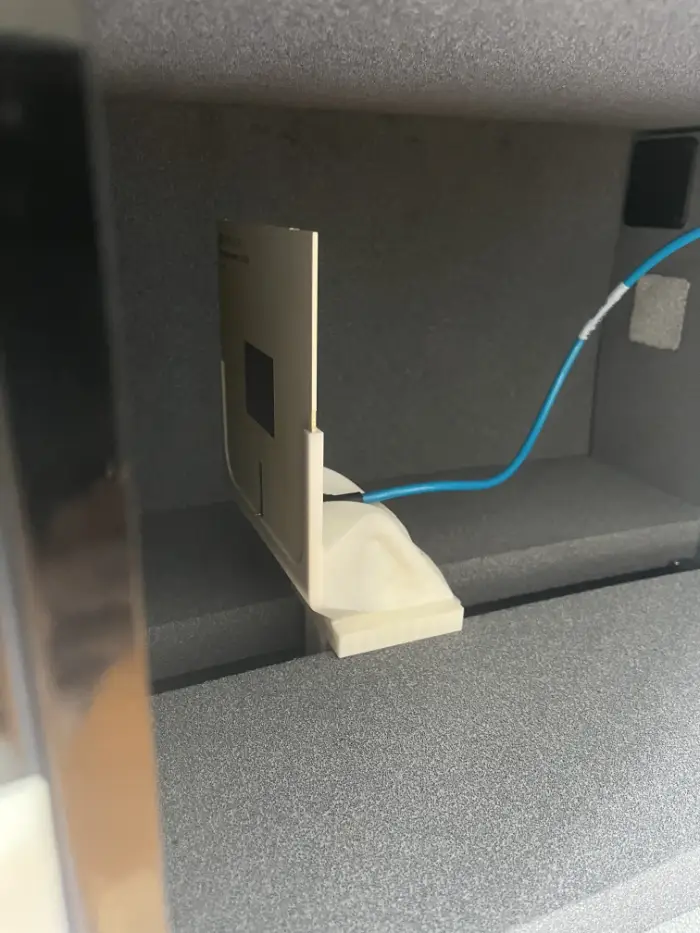
During her patch antenna project, Imane Khalloufi’s main difficulty was mechanical. The original polarizer was slightly rectangular and a little too large. It fitted into the setup in one orientation but not the other.
The first idea was to rotate the antenna instead. Imane Khalloufi set it aside: turning the antenna would have changed the spatial reference frame and risked skewing the results. The solution was to rotate the polarizer rather than the antenna. The reference frame stayed strictly identical from one measurement to the next.
It is a small decision, but a telling one. Keeping the measurement frame fixed is a basic rule of experimental rigor, and the project gave her a concrete reason to apply it.
What results did the patch antenna measurements deliver?
Imane Khalloufi validated a method to determine the linear polarization of her patch antenna, and designed two improved polarizers.
| Outcome | Detail |
|---|---|
| Polarization method | Validated for the linear polarization of a patch antenna, using successive E-field maps with and without a polarizer |
| New polarizers | Two new designs mounted on PLA supports, to avoid edge effects; according to her, they significantly improved performance over the original polarizer |
| Cross-polarization ratio | Average of -15 dB in the main lobe |
The -15 dB figure comes from the ratio of cross-polarization to co-polarization. Co-polarization is the field component aligned with the intended polarization. Cross-polarization is the orthogonal, unwanted component. To measure each one, she placed the polarizer perpendicularly, first for the horizontal component, then for the vertical one.
"With this ratio, I obtained an average attenuation of -15 dB, which means we can cut up to -15 dB of the unwanted component in the main lobe." — Imane Khalloufi
What would the project have looked like without measurement?
The whole internship rested on observing the antenna’s polarization experimentally. Without a measurement bench, the work would likely have stayed on the computer.
"I would probably have been limited to theoretical simulations on a computer, without access to concrete experimental data or real prototyping. The tool brought real experimental value to my work." — Imane Khalloufi
Why do antenna field maps build physical intuition in students?
Imane Khalloufi first saw EMBox Lab in class, where it was used as a visualization tool during her electromagnetics course. The internship let her move from watching a demonstration to running her own measurements.
"This tool gives students real physical intuition, by making concrete the theory and the sometimes abstract calculations we do in class. You finally understand what actually happens to electromagnetic waves in reality." — Imane Khalloufi
For Imane Khalloufi, the color-coded maps are what spark curiosity. A student sees the field first, then looks for the physics that explains it.
For a professor’s perspective on the same tool, read How EMBox Lab is transforming antenna measurement education, with Cyrille Menudier of XLIM (University of Limoges).
What would make EMBox Lab field maps easier to read?
Imane Khalloufi’s suggestion for EMBox Lab concerns the software display. She would add a dashed contour on the field map marking the -3 dB zone, the area where no more than half of the power is lost.
That zone is the most useful one to characterize the main lobe of an antenna. Drawing it directly on the map would make results even faster to read. It is the kind of field feedback that only comes from a user working on a real project.
What is the cross-polarization ratio of an antenna?
It compares the unwanted field component (cross-polarization) with the intended one (co-polarization), usually in dB. A strongly negative value means the unwanted component is weak compared with the desired one.
Does measurement replace simulation or a VNA?
No, the three are complementary. A VNA characterizes the antenna port, simulation predicts behavior, and field mapping shows how the antenna radiates in space. EMBox Lab’s Compare function can overlay a measurement with imported HFSS, FEKO or CST simulation results.
How do you know whether you are measuring in the far-field?
A common criterion is the Fraunhofer distance, 2D²/λ, where D is the largest antenna dimension and λ the wavelength. EMBox Lab also includes a Far-Field function that computes the radiation pattern, gain and half-power beamwidth from a near-field measurement.
Bring real measurement into your students' projects
Professor, lab supervisor or internship tutor? Contact Anyfields to test EMBox Lab in your next course or student project, and give your students the chance to confront theory, simulation and measurement.
See the field. Measure it. Understand it.
About Imane Khalloufi

Imane Khalloufi is an engineering student in electronics at ENSEEIHT. After two years of classes préparatoires (MP track), she completed her internship on patch antenna polarization at the LAPLACE laboratory in Toulouse. She plans to specialize in radio frequency or integrated systems.
EMBox Lab
Educational tool that helps students understand electromagnetic phenomena through real-time visualization of antenna radiation patterns.